Technical Confluences Detector
What is the Technical Confluences Detector?
The FXS Technical Confluences Detector is an in-house tool, developed by FXStreet experts, that allows you to identify those price levels where congestion of indicators like moving averages, Fibonacci levels, Pivot Points occurs. Knowing where these congestion points are located is very helpful as it allows the trader to see these areas of support and resistance easily.
This tool is customizable so you can choose the asset selectors and the time frame that are more suitable for your trading operations.
Read more about the Technical Confluences Detector.
Gold tests critical daily support line, will it defend? Premium

Gold price is seeing a negative start to a new week on Monday, having booked a weekly loss. Gold price bears the brunt of resurgent US Dollar (USD) demand and a risk-on market mood amid Japanese holiday-thinned market conditions.
Focus on the Fed and US Nonfarm Payrolls this week
The risk rally in Asia extends early Monday, following a strong close on Wall Street last Friday and a robust Alphabet earnings report, fuelling a fresh decline in the safe-haven Gold price even though the US Treasury bond yields nurse recent losses.
Best brokers in your location
Forex
Commodities
Cryptos
What are the Technical Confluences Detector?
HOW DOES IT WORK?
CONFLUENCE OF TECHNICAL LEVELS
This tool assigns a certain "weight" to each indicator according to its class and time range. This "weight" is propagated to adjacent price levels – even if those levels do not contain any indicator – to highlight the influence of the force of attraction generated by the presence of important indicators such as a simple moving average or a Pivot Point level in a daily range. The algorithm's logical structure intensifies the signal's strength in those areas where several indicators converge – so-called technical confluence zones.
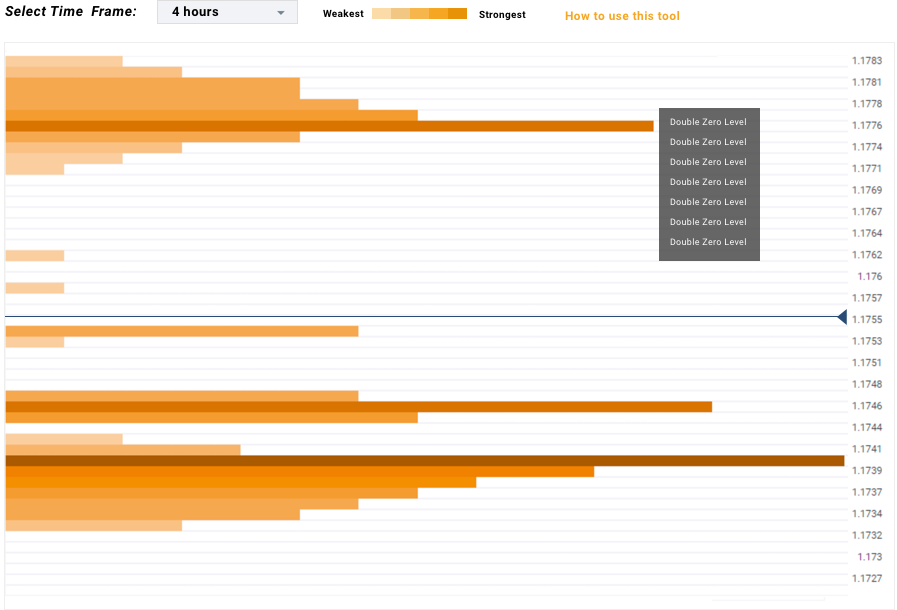
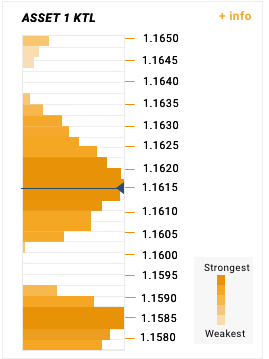
HOW TO READ THE CHART?
The tool detects and draws the price levels where indicators are placed, highlighting those levels where several indicators converge simultaneously. The length of each bar indicates the intensity of the resistance or support levels generated by the technical indicators. We have also implemented a color gradient to intensify the bars' tonality where the Technical Confluences Detector finds more resistance to price advance. The white lines represent areas where no technical indicator is detected and where the price can move with ease.
TOOLTIP
You can see which indicators are within each price level by placing the cursor over the bar price level. The explanation uses a code that indicates:
- Previous daily, weekly and monthly highs and lows.
- Pivot Points
- Moving averages
- Bollinger bands
- Fibonacci retracements
HOW TO USE IT?
With the FXS Technical Confluences Detector tool, you can quickly locate the areas where the price can find a support or resistance zone and make trading decisions. If you are a short-term trader, you will find entry points for counter-trend strategies and hunt a few points at a time. If you are a medium-to-long-term trader, this tool will allow you to know in advance the price levels where a medium-to-long-term trend may stop and rest, where to unwind positions, or where to increase your position size.